How to read crypto charts for Beginners
DS Crypto
Key Points
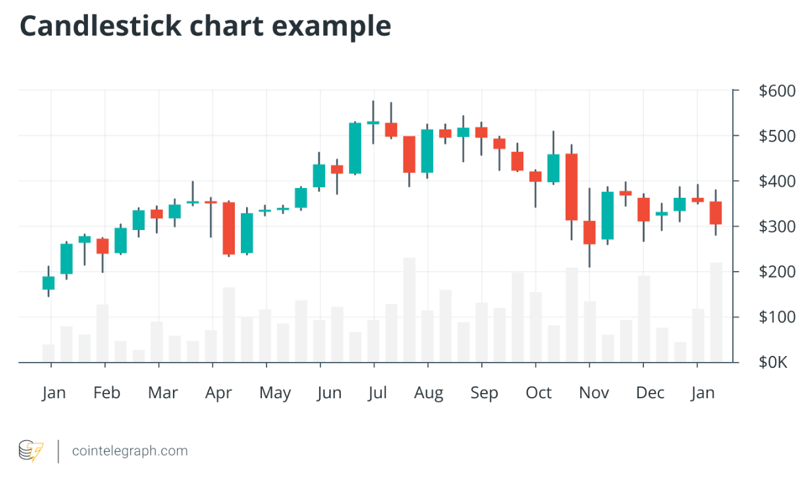
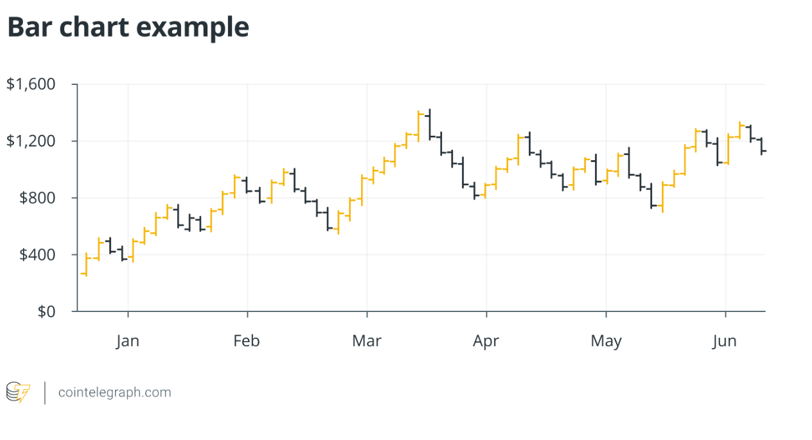
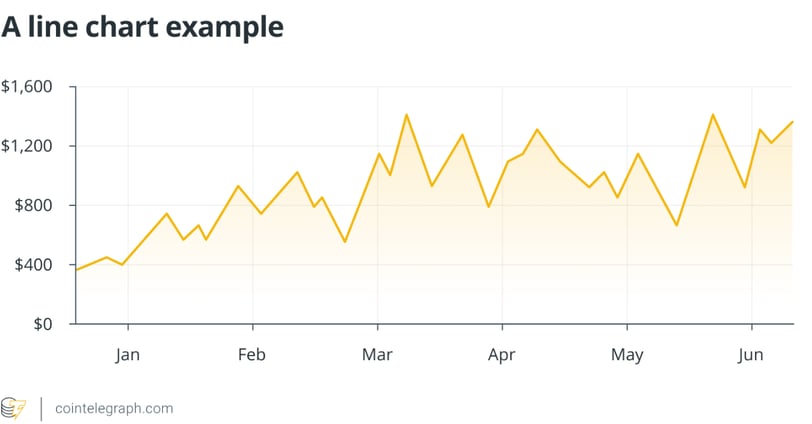
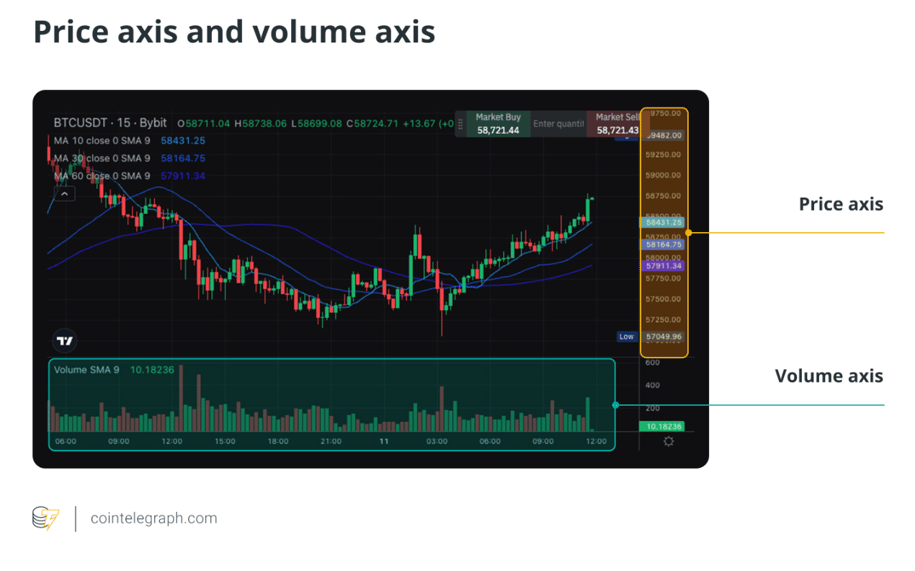
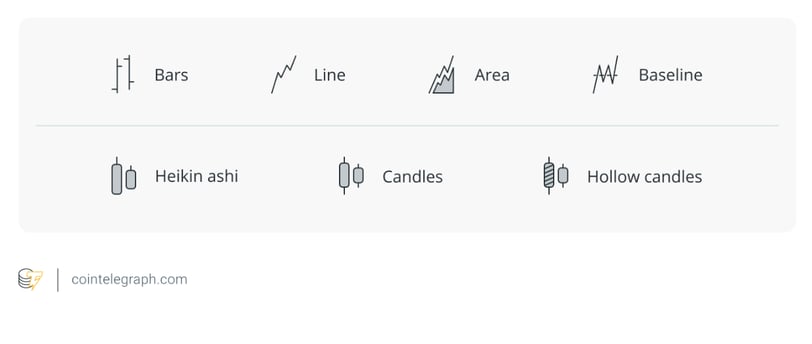
Crypto trading charts, such as line charts, bar charts and candlestick charts, show how crypto prices and other information changes over time.
Understanding how to read cryptocurrency charts for day traders is essential for analyzing cryptocurrency trends and determining price movements.
Popular overlays and indicators on live crypto charts help traders make informed decisions.
Noticing common bullish and bearish patterns is important for successful crypto trading and trend following.
Using multiple indicators and backtesting strategies is important to improve trading approaches.
Why do you need to understand charts?
Understanding cryptocurrency trading charts is essential for anyone diving into the world of crypto trading or investing. These charts offer a visual breakdown of market data, enabling traders to analyze price movements, detect patterns, and assess trends for more strategic decision-making. By scrutinizing charts, traders can gauge whether the market is in a bullish or bearish phase, forecast future price shifts, and identify ideal moments to buy or sell assets. Additionally, charts are key to establishing risk management strategies, such as placing stop-loss or take-profit orders.
However, reading these charts isn’t straightforward. Mastery requires familiarity with technical analysis, a field that takes time and practice to conquer. Traders need to recognize various chart patterns, like head-and-shoulders, double tops and bottoms, and triangles, which signal potential price changes. A head-and-shoulders pattern may point to a trend reversal, while a triangle formation could suggest ongoing momentum. Although interpreting these signals is complex, it is a crucial skill for navigating the crypto market effectively.